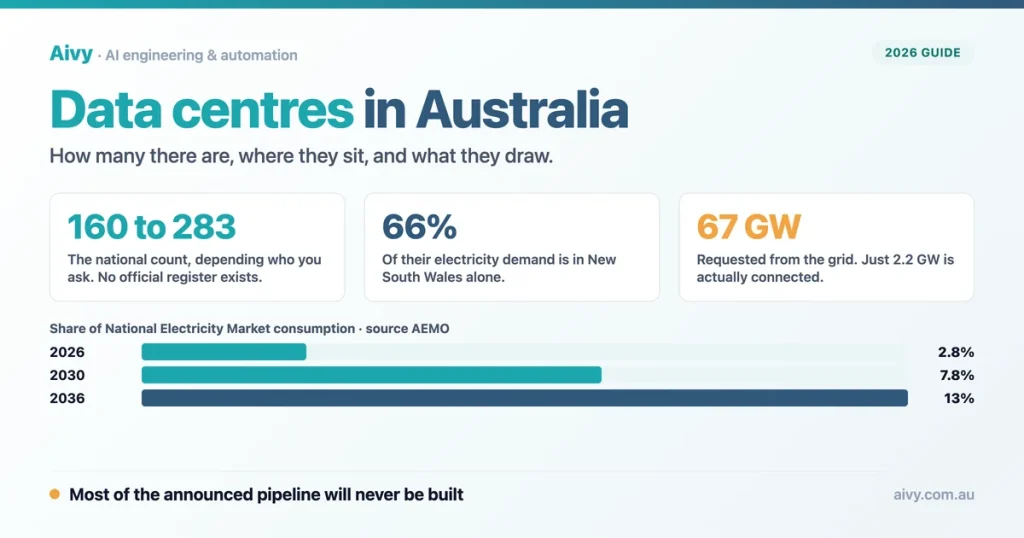
Somewhere not far from you, a shed the size of a shopping centre is drawing as much power as a small town, and almost nobody can tell you how many data centres Australia now has. Ask three credible organisations and you get three different numbers, none of them wrong exactly, none of them the same. The Australian Bureau of Statistics does not keep a register of them. That gap is the honest place to start.
I run content and growth at Aivy, an AI and automation consultancy in Melbourne, and this question has crept into client conversations that started somewhere else entirely. A bookkeeper asks whether her client files sit in Australia. A builder asks why a site near Dalby is suddenly worth $31.9 billion. A retailer asks whether her power bill is about to pay for someone else’s graphics cards. All three are the same question wearing different clothes.
So this is the whole picture, assembled from the regulators rather than from press releases: how many there are, where they sit, what they draw from the grid and from the water supply, how much of the announced pipeline is real, who owns them, and what any of it has to do with a business that just wants to use AI without a surprise. Where the numbers disagree, I have shown you the disagreement instead of picking a favourite.
How many data centres are in Australia, and why nobody agrees on the number
There is no official register. The Bureau of Statistics does not treat data centres as a category of their own, folding them into a broader industry division and reaching for proxies instead: capital expenditure across that division, building approvals filed as commercial building not elsewhere classified, and imports of the equipment that goes inside. When the national statistician has to triangulate, you should expect everyone else to disagree.
And they do. The Australian Energy Market Operator counts about 165 in the market it runs. A commercial directory lists 283 across 70 operators. A university research centre puts the parc above 250 facilities. Those are not contradictions so much as different questions: one counts grid connections, one counts listings, one counts buildings. Each is defensible alone and useless beside the others, which anyone in professional services who has reconciled two vendor reports will recognise.
What this means in practice is that any headline claiming a precise national count is quietly choosing a definition it has not told you about. When a client asks me how many there are, I give the range and the reason for the range. It is a less satisfying answer and a far more useful one, and it is the same instinct that should govern how you read any vendor number in the AI and automation space.
| Who is counting | The count | What it actually covers |
|---|---|---|
| AEMO | About 165 | Operating sites in the National Electricity Market only. Excludes WA and the NT. |
| JLL | 162 | National, September 2026, alongside 1.2 GW of installed capacity. |
| United States Studies Centre | More than 250 | National, about 1.4 GW, with close to 80 per cent of capacity in NSW and Victoria. |
| Baxtel directory | 283 | A commercial listing, not a register. NSW 127, VIC 61, QLD 29, WA 24. |
| ABS | No count | No separate category exists. The national statistician uses proxies. |
Where Australia’s data centres are, and why Sydney and Melbourne hold nearly all
The concentration is severe and it is not an accident. New South Wales accounts for about two thirds of the electricity that data centres draw from the National Electricity Market, and Victoria takes most of the remainder. South Australia, Queensland and Tasmania together account for a rounding error. Research from the United States Studies Centre puts close to 80 per cent of national capacity in those same two states.
The reasons are boringly practical. Operators build near their customers, near the technical labour they need to keep the buildings running, and near the fibre. Latency requirements pull facilities towards the population, and the need for geographic redundancy means a second site has to be far enough from the first to survive a different disaster while staying close enough to be useful. Sydney and Melbourne satisfy all four conditions and almost nowhere else does.
That matters for anyone choosing where to run workloads. If you are a business in Sydney or Melbourne, the infrastructure is on your doorstep and the competition for grid capacity is fiercest at your door too. If you are anywhere else, your traffic is almost certainly travelling to one of those two cities before it does anything useful.
Two states take almost all of it
Share of data centre electricity demand in the National Electricity Market, axis 0 to 100%. Excludes Western Australia and the Northern Territory, which sit outside the NEM. Source: AEMO Electricity Statement of Opportunities 2026.
Electricity and the grid: 2.8 per cent now, 13 per cent by 2036
This is the number everyone argues about, so here it is with its denominator attached. In the 2026 financial year, data centres in the National Electricity Market consumed about 5 TWh, which is 2.8 per cent of operational consumption across that market. Note what that is not: it is not a share of all Australian electricity, because the NEM excludes Western Australia and the Northern Territory.
Under AEMO’s central scenario the figure roughly triples to about 15 TWh, or 7.8 per cent, by 2030. By 2036 it reaches about 34 TWh and 13 per cent of forecast operational consumption, close to seven times today’s level, after which the growth rate eases. In a high growth sensitivity the 2036 figure is about 52 TWh instead, some 56 per cent above the central case.
For scale, and it is the comparison I reach for when a client asks how big this is against the rest of the economy we automate, Australia’s four aluminium smelters draw roughly 2,600 MW continuously and account for something like a tenth of NEM consumption. So data centres today are a smaller load than aluminium and are forecast to overtake it comfortably within a decade. The reliability picture holds even in the fast case: AEMO concludes the system copes even if the 2036 level arrives four years early.
Forecast data centre electricity use in the NEM
TWh per financial year, scaled to the largest bar. The 2036 high sensitivity is a stress case, not a forecast. Source: AEMO Electricity Statement of Opportunities 2026, Step Change scenario.
New South Wales feels this first and hardest. The state government’s own consultation work has data centres moving from about 5 per cent of NSW grid energy in 2026 to 11 per cent by 2030, and that is happening while roughly 7 GW of coal generation leaves the system. For a sense of proportion, every NSW government building plus Transport for NSW together account for 4 per cent of grid demand.
The connection pipeline: most of the announced gigawatts will never be built
This is the part that changes how you read every other number. There are 225 data centre projects in the NEM connection process, and the capacity they have asked for jumped from 38 GW to 67 GW in a single year. Read alone, that sounds like a wall of concrete heading for the grid. Read alongside the cancellation data, it looks like something else entirely.
About 36 per cent of the projects on AEMO’s 2025 list have since been cancelled, and the cancellations reach every stage of development, including projects that network providers had already classified as committed. Independent modelling for AEMO puts it more bluntly still: of roughly 44 GW of connection requests, six in every seven megawatts are expected never to materialise. The industry term for this is phantom demand and it is the norm, not the exception.
The operating fleet tells the same story from the other end. Sites already running hold 2.2 GW of maximum contracted connection capacity but were using only 27 per cent of it, while running almost flat at close to 90 per cent load factor. AEMO estimates a mature fleet would average 45 to 51 per cent. Developers book grid capacity the way restaurants take bookings, and the no show rate is high. Stated intent minus delivered capability is precisely what a business audit is for.
Booked versus actually used
Share of contracted grid connection capacity in use, axis 0 to 100%. Source: AEMO Electricity Statement of Opportunities 2026.
AI data centres in Australia are not the main driver, at least not yet
Given how the topic is covered, this one surprised me. Modelling prepared for AEMO found that the first wave of AI would add about 9 TWh by the end of the forecast horizon if efficiency stood still, but that once efficiency gains are netted off, the peak contribution is roughly 0.9 TWh around 2028. The main engine of growth is ordinary demand for data centre services, not model training.
That does not mean AI is irrelevant, and the very largest proposals are unmistakably AI shaped. A proposal lodged with the Western Downs Regional Council in Queensland covers 725 hectares near Dalby, 2.16 GW, and $31.9 billion. It would consume 47 GWh a day, which on its own would lift Queensland’s daily electricity consumption by about a quarter. One building, one quarter of a state.
The practical reading for a business is that the infrastructure story and the AI story are running on different clocks. If you are weighing whether to run models on your own hardware or through a provider, or through a local agent setup, the grid forecasts are not the reason to choose either. In my experience the deciding factors are far more prosaic: where your data is allowed to go and who is accountable when it moves.
Water and cooling: the number nobody is required to report
Australian data centres consume roughly 5.5 gigalitres of water a year, and the industry’s own projection has that reaching 17 GL by 2030. Next to agriculture that is nothing. Next to a city’s drinking water it is not, which is why the argument gets heated: the forecasts for Sydney differ by a factor of ten depending on who prepared them.
Today, Sydney data centres draw about 3.5 billion litres a year from the city’s potable supply, under 1 per cent of total demand. An industry commissioned report projects 1.9 per cent by 2030. Sydney Water models a scenario reaching 250 megalitres a day by 2035, or 15 to 20 per cent of supply. The pricing regulator looked at that spread and declined to price any allowance for data centres into the 2025 to 2030 determination at all.
The requests utilities are fielding explain the nerves. Australian water businesses report enquiries of between 5 and 40 million litres a day, up to twenty times their largest single existing customer and equivalent to 70,000 to 80,000 households. Documents released under freedom of information in western Melbourne showed 19 applications seeking 19,714 megalitres of potable water a year, against the 33.1 ML that thirteen of the fifteen existing centres in that area used across an entire year.
Two technical details decide most of this. Evaporative cooling loses roughly 80 per cent of its water and tops up continually, while closed loop and immersion systems use far less water and more energy. Hybrid designs hide a trap: the inner loop can be remarkably water efficient while the outer loop dumping the heat is still evaporative. No operator is required to tell you which they run, and that reporting gap is the one that also produces shadow AI in Australian workplaces.
Three forecasts for Sydney, one factor of ten
Data centre share of Sydney’s potable water supply, axis 0 to 100%. Each bar is a different forecaster, not a different year of the same forecast. Source: Water Services Association of Australia, Data Centres and Water in Australia.
Power bills, network costs and who actually pays for the build
This is the question underneath every other question, and the honest answer is that it depends on a rule change that has not happened yet. Today a data centre pays only for the network augmentation that is causally and incrementally linked to its own connection. Upstream transmission costs are not recovered from loads connecting at the distribution level, and that is one of seven identified gaps in the current arrangements.
Modelling for the Clean Energy Finance Corporation puts a figure on it. If that demand arrives without new renewable generation, wholesale prices would be about 26 per cent higher in New South Wales and 23 per cent higher in Victoria by 2035, driven largely by heavier use of gas. Wholesale costs are roughly 40 per cent of a typical household bill and network costs sit between 33 and 48 per cent depending on the region, so a move of that size is real without being the whole bill.
The industry’s counter is worth taking seriously rather than dismissing. A report commissioned by Amazon argues the framework is already cost reflective, since distribution connections face a regulatory cost and revenue test and dedicated transmission assets are recovered in full from the data centre. Notably, both sides describe the same mechanism: even the industry report accepts that a large new inflexible load can push the system to call on more expensive plant at the margin.
There is a version of this where bills go down. Transgrid has more than 8 GW of data centre load in advanced negotiation, against average daily NSW demand of roughly 7.5 to 10 GW. It calculates that charging for full contracted capacity rather than actual use would spread fixed costs wider and could cut transmission costs to consumers by as much as 15 per cent. Whether that happens is a regulatory decision, and you can test your own exposure with our AI ROI calculator.
The rulebook: New South Wales moved before the Commonwealth
Because two thirds of the load is in New South Wales, the state has moved ahead of the Commonwealth, and its framework is the closest thing Australia has to a rulebook. The mechanism is worth understanding because it is an incentive rather than an obligation, and the difference matters if you are trying to work out what anyone is actually required to do.
A data centre in NSW becomes State Significant Development once it exceeds 15 MW of total consumption, which moves the decision to the planning commission or the minister. From August 2026, developments meeting a set of performance measures receive a commitment to assessment within 75 days. Hit the targets and your application moves faster; miss them and you are assessed normally. For anyone used to genuinely binding regimes, such as the Essential Eight, the distinction takes getting used to.
The targets are specific: design power usage effectiveness of 1.25 with design water usage effectiveness at or below 1.0 for potable water, or 1.3 paired with 0.44. The fast lane also wants power purchase agreements backed by new NSW generation, at least 40 per cent wind, storage worth a quarter of generation capacity at four hours, and contracts of ten years or more. Applicants must show they can cut grid draw by 25 per cent for two hours, and diesel does not count.
| Instrument | Status at September 2026 | What it actually requires |
|---|---|---|
| NSW State Significant Development | Binding | Above 15 MW the decision sits with the planning commission or the minister. |
| NSW Data Centre Policy Framework | Voluntary incentive | Meet the performance measures, get a 75 day assessment commitment. Nothing is compelled. |
| NSW efficiency targets | Guideline, not a legal standard | dPUE 1.25 with dWUE 1.0 potable, or dPUE 1.3 with dWUE 0.44. |
| Demand response capability | Guideline | Show a 25 per cent grid reduction for up to two hours. Diesel does not count. |
| National mandatory standards | Proposed only | Agreed in principle in August 2026, with legislation flagged for early 2027. Nothing binding today. |
If your own organisation is trying to write internal rules for technology that regulators have not caught up with yet, the shape of the problem is the same one we cover in our AI policy template for Australian businesses, and the same instinct applies: write down what is binding, what is guidance, and what is merely announced, and never let the three blur together.
Frequently asked questions about data centres in Australia
How many data centres are there in Australia?
Estimates range from about 160 to 283 depending on the source and the definition. There is no official register, because the Bureau of Statistics does not treat data centres as a separate category and relies on proxies instead.
Where are most of Australia’s data centres?
New South Wales and Victoria hold the overwhelming majority. New South Wales accounts for about 66 per cent of the electricity data centres draw from the National Electricity Market and Victoria about 30 per cent, leaving the other states with very little.
How much electricity do Australian data centres use?
About 5 TWh in the 2026 financial year, which is 2.8 per cent of operational consumption in the National Electricity Market. AEMO forecasts roughly 34 TWh and 13 per cent by 2036 under its central scenario.
Do data centres increase electricity bills in Australia?
Not directly today, because a data centre pays only for network augmentation tied to its own connection. Modelling suggests wholesale prices could be materially higher by 2035 without new generation, but the rules that decide cost sharing are still being written.
How much water do data centres use in Australia?
Around 5.5 gigalitres a year nationally, with the industry projecting 17 GL by 2030. Sydney’s data centres currently use under 1 per cent of the city’s potable supply, though forecasts for 2035 vary by a factor of ten.
Is Australia’s data centre growth driven by AI?
Less than the coverage suggests, at least so far. Modelling for AEMO puts the net peak contribution of the first AI wave at roughly 0.9 TWh around 2028, with general demand for data centre services remaining the main driver.
Are there mandatory rules for data centres in Australia?
Very few. New South Wales has the most developed framework, but its efficiency and demand response targets are guidelines attached to a faster assessment, not legal standards. National mandatory standards were agreed in principle in August 2026 and are not yet law.
Can I find out which data centre holds my business data?
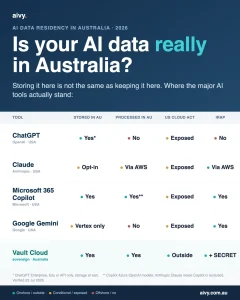
Usually yes, through your provider’s documentation rather than any public register. Cloud providers publish their Australian regions, though where data is stored and where it is processed are different questions and often have different answers.
Is it a problem that so much capacity is booked but unused?
It is the central planning problem. Operating sites use only 27 per cent of their contracted connection capacity, and around 36 per cent of projects on AEMO’s 2025 list have been cancelled, which makes headline pipeline figures unreliable.
What Australia’s data centre boom means for your business
The infrastructure story and the decision in front of most Australian businesses are further apart than the headlines suggest. Gigawatt announcements are applications, not buildings. A 13 per cent share of the grid is a forecast with a denominator attached, not a crisis. And the single most useful habit when reading any of it is to ask what was counted before accepting what was concluded.
What I notice in client conversations is that the data centre question almost never arrives on its own. It turns up attached to something concrete: whether a file can leave the country, whether a tool is allowed under an existing policy, whether a cost will move. Those are answerable questions, and they are answerable without knowing a single gigawatt figure. The infrastructure is context, not the decision.
If the part you actually care about is where your own data goes when you use an AI tool, that is a separate question with a separate answer, and we have written it up in detail in our guide to AI data residency in Australia. If you would rather talk it through against your own stack, we are Aivy, an AI and automation team working with Australian businesses, and you can book a conversation or start with our free AI readiness assessment.
Last updated: 18 September 2026. Electricity and connection figures are from AEMO’s 2026 Electricity Statement of Opportunities and move with each annual release. Regulatory status is stated as at this date and several instruments were still in consultation.
• AEMO, 2026 Electricity Statement of Opportunities · 5 TWh and 2.8% in FY26, 15 TWh and 7.8% by 2030, 34 TWh and 13% by 2036, 52 TWh high sensitivity, 225 projects and 38 GW to 67 GW, 36% cancellations, 2.2 GW contracted at 27% utilisation and 45 to 51% mature fleet, state demand split
• Australian Bureau of Statistics, Spotlight on data centres · no separate category and no official register; the proxies used instead
• Infrastructure NSW, Data Centre Guidelines · State Significant Development above 15 MW, the 75 day commitment, dPUE 1.25 and dWUE 1.0 or 1.3 and 0.44, the power purchase agreement and storage conditions, the 25% demand reduction test, NSW moving from 5% to 11% of state grid energy
• Water Services Association of Australia, Data Centres and Water in Australia · the 1.9% and 15 to 20% Sydney forecasts, enquiries of 5 to 40 ML a day and the 70,000 to 80,000 household equivalence, 80% evaporative loss, the hybrid loop trap
• Climate Council, data centre report · Baringa and CEFC modelling of 26% higher wholesale prices in NSW and 23% in Victoria by 2035 without new renewable generation
• Oxford Economics, estimating data centre phantom demand · six in seven megawatts of connection requests expected never to materialise, across roughly 44 GW of requests